Turning Warranty Claims Into Product Improvements
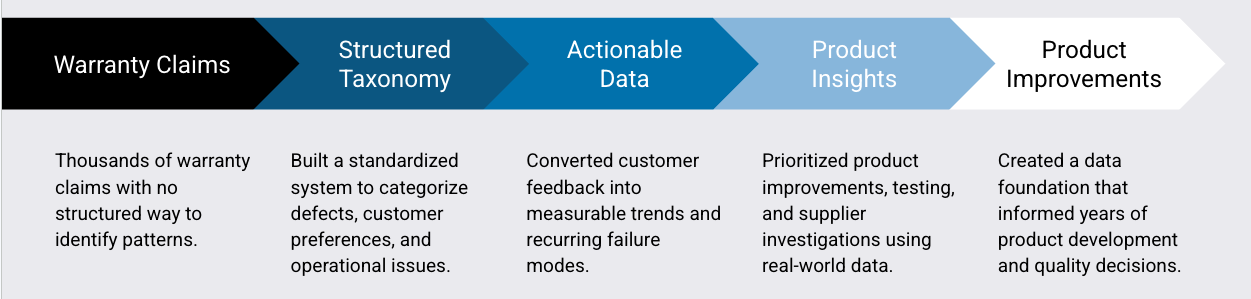
I built a structured RMA data system from scratch, turning warranty claims into a measurable source of product intelligence — and a foundation that shaped Away's luggage development for years afterward.
The Challenge
Away had no shortage of customer feedback: an in-house CX team, a retail store ten minutes from HQ, a steady flow of customer photos. What was missing was the quantitative half. Without a way to pull data, there was no way to know which defects were frequent, what they cost, or which problems to solve first.
Quality RMAs - Product defects and failures
[Component] Zipper
Puller Broken
Coil Broken
Other failure modes
Non-Quality RMAs - Customer preference or expectation
Color
Size
Material preference
Operational RMAs - Fulfillment and delivery issues
Incorrect product
Delivery issue
Transit damage
What I built
A defect taxonomy detailed enough to act on, but not so detailed it slowed the CX team down. Three categories: Quality (product defects and failures), Non-Quality (customer preference and expectation), and Operational (fulfillment and delivery).
Then three ways of reading it: frequency by reason; reason cut by size and style — were wheel failures concentrated on the larger cases people pack heavier?; and time to failure, because a defect at 30 days and a defect at five years are different problems needing different responses.
Analysis & Actions
Steer the team from feelings to facts.
The most dramatic-looking failures aren't always the ones causing the most damage.
How we looked at the data
Frequency by RMA reason
Reason by size and style — were wheel failures concentrated on the larger cases people pack heavier?
Time to failure — a defect at 30 days and one at five years are different problems, managed differently
What we did with the data
It steered Away's luggage work for the next three to five years.
Sorted defects onto an impact vs. complexity matrix.
Audited measurement, inspection and QC — some items were being looked at but never measured or tested.
Separated design failures from manufacturing and assembly issues, then modified or redesigned components.
Unified assembly methods, wrote assembly specs, added jigs, adjusted materials, and tested repeatedly.
Fed non-quality and operational findings to other teams — size, weight and materials information that was driving returns.
What began as a way to categorize warranty claims became a quality intelligence system.
The Implementation Challenge
Build the system around the people who have to use it.
The theoretically perfect RMA system isn't the operationally successful one. I wanted hundreds of specific failure types; CX is measured on resolution speed, and customers are often vague. The final taxonomy was a deliberate compromise — 176 potential reasons cut down to 115, merging distinctions that were technically different but operationally the same problem. Did every type of hardware need its own reason, or could "Hardware" carry it, with photos and returned samples supplying the detail?
The Impact
The data sorted defects onto an impact-versus-complexity matrix and separated design failures from manufacturing and assembly issues. It drove component redesigns, unified assembly methods and specifications, and exposed inspection gaps where items were being looked at but never measured. Several failure modes were significantly reduced in later iterations, and the resulting specs and testing protocols became standard for new products.
Key Takeaways
Design the system with CX, not for CX. What matters is what customers actually provide and what the team can capture without slowing down.
Standardize Terminology early, or component names and varying specificity will fragment your data.
Interrogate anomalies before acting. One apparently frequent failure turned out to be the first alphabetical option, auto-selected whenever an agent left the field blank. Data collection behavior can look exactly like a product signal.
Have a return or warranty problem like this one?
Most companies are sitting on more product intelligence than they realize. If your returns data isn't telling you anything yet, that's usually a structure problem, not a data problem.